7 min read
Bitcoin defends 80,106
Bitcoin ended the week near $81,960 on Coinbase, down 1.34% inside a $4,586 range. The hot September CPI on October 14 and nearly $1 billion of liquidations on October 15, about 90% of them longs, pushed it to a weekly low of $79,676. The CPI print showed annual inflation at 3.7% against a 3.6% forecast and lifted the odds of a December Fed hike to about 89%, a week after the 10-year Treasury yield hit 5.35%, its highest since 2002. Buyers stepped in below $80,000, close to the $81,500 average cost basis of US spot ETF holders. The funds still lost $228.4 million over the week after $681.1 million the week before, about $910 million in two weeks.
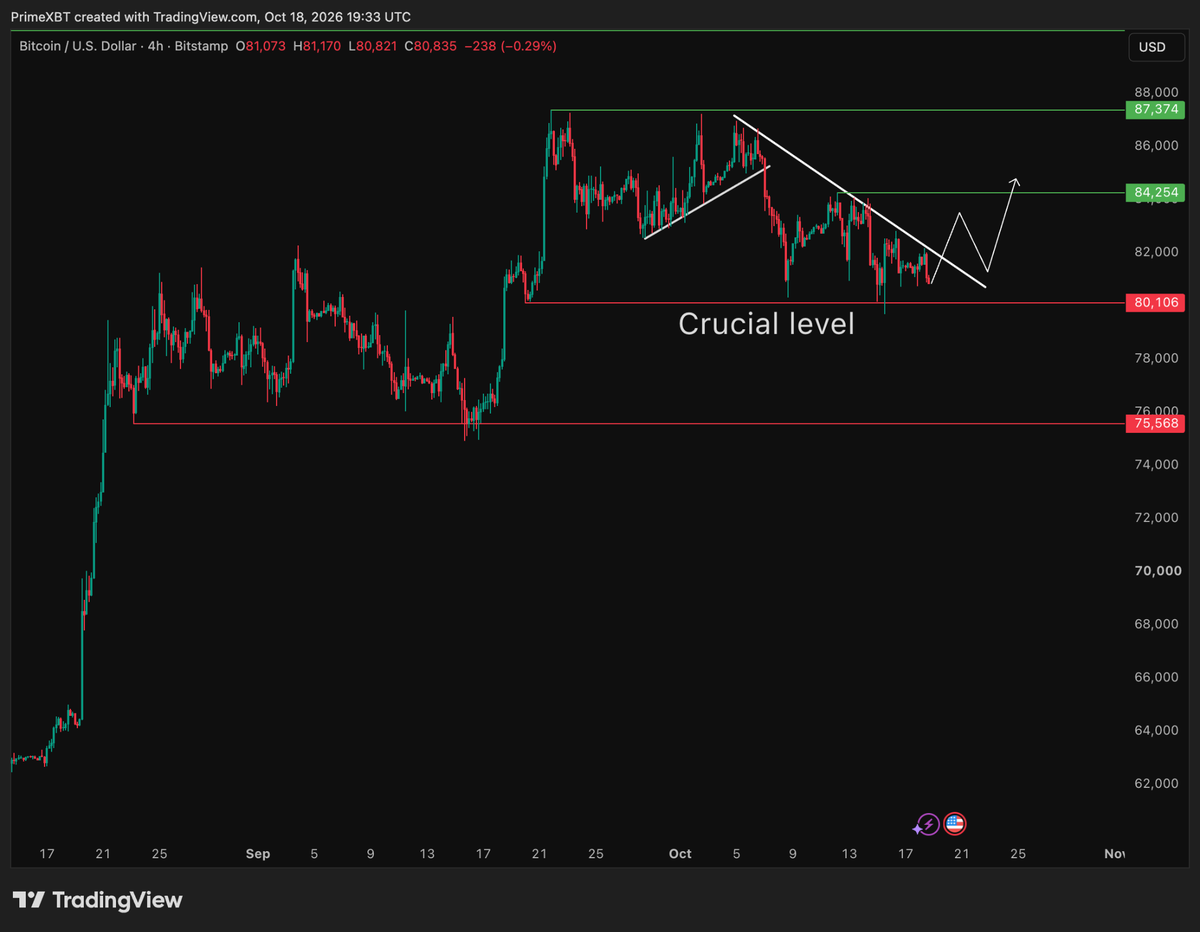
On the 4h chart, 80,106 is the crucial level. Price has held it on every close since September 20, with only a wick below on October 15. A descending trendline from the October 5 high near 87,000 caps each bounce and now runs near 82,000. A break above it, followed by a retest from above, opens the path toward 84,254 and then the range top at 87,374. A 4h close below 80,106 would turn the picture negative. Glassnode puts the True Market Mean, the cost basis of active investors, at $77,500 to $78,000, the first support below the line. Under that, 75,568, the level that held in late August and again in mid-September, comes back in play.
Crypto heatmap
The heatmap is almost entirely red. Bitcoin lost 3.06% to $80,900, a smaller drop than most large caps: Ethereum fell 6.79% to $2,346.61, Solana 8.5% to $101.60 and XRP 9.66% to $1.2685. BNB held up better at -5.43% to $710.21, as did Bitcoin Cash at -5.23%.
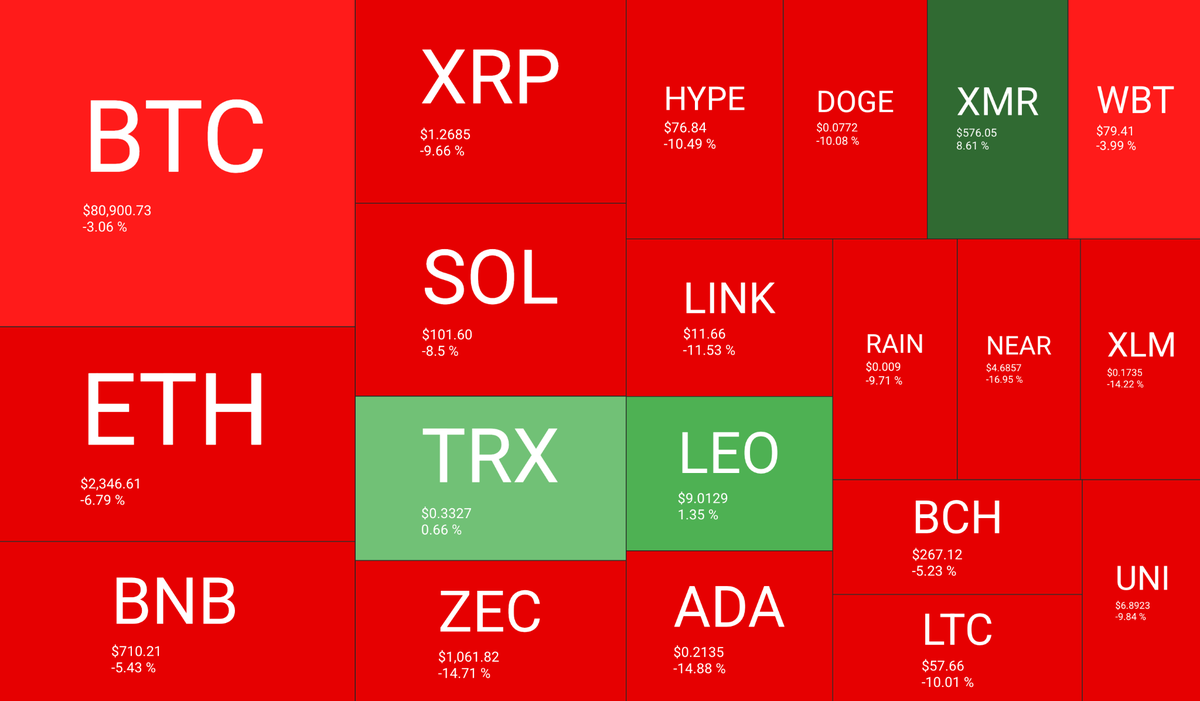
The heaviest losses hit NEAR at -16.95%, Cardano at -14.88%, Zcash at -14.71% and Stellar at -14.22%, with Chainlink down 11.53%. Only three names finished green: Monero up 8.61% to $576.05, LEO up 1.35% and Tron up 0.66%. Bitcoin falling least is typical of a risk-off week in which altcoin exposure is cut first, consistent with the breadth reading in the next section.
Altcoin Season Index slips to 50
The CoinGlass Altcoin Season Index fell to 50, exactly midway between Bitcoin Season and Altcoin Season. The index compares the performance of the top altcoins with Bitcoin, and readings above 75 define an altcoin season.
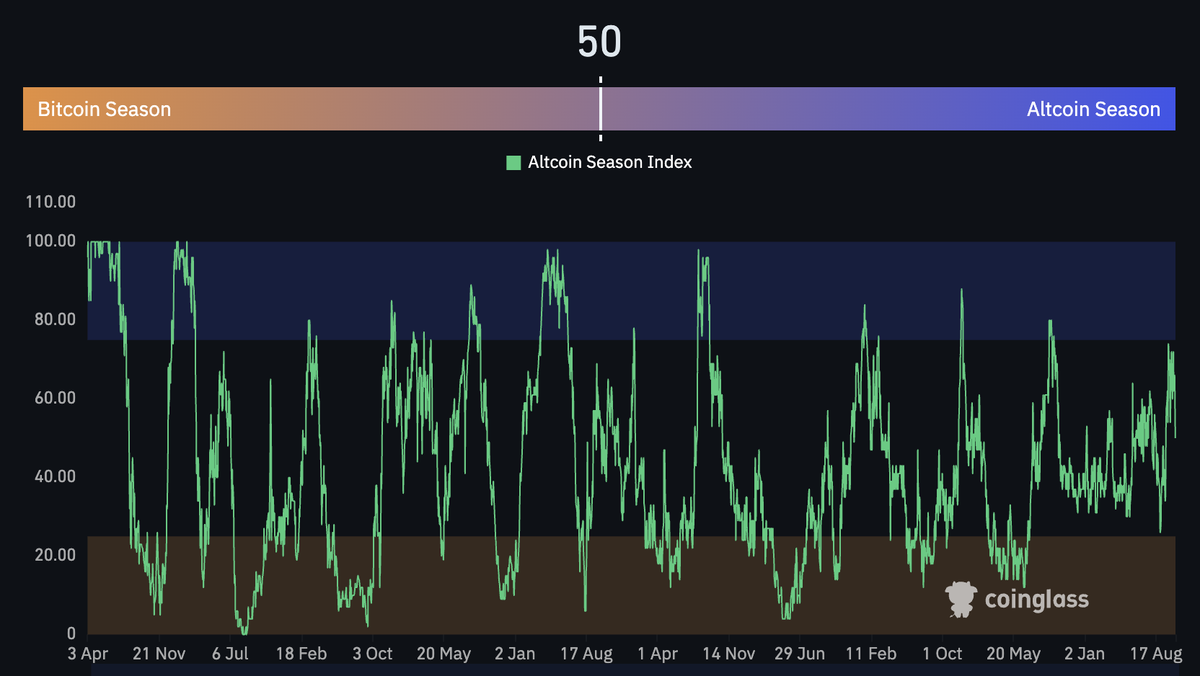
The latest swing peaked in the low 70s and fell short of that threshold before turning lower with the heatmap above. The index has not reached the altcoin season zone since its spike to about 80 in 2025. For altcoins to take the lead, the reading would need to reclaim the 70s while Bitcoin stabilizes above 80,106.
Fear and Greed cools to Neutral
The Crypto Fear and Greed Index on CoinGlass reads 54, Neutral. It stood at 64 on October 16 and dropped 10 points in a day as Bitcoin slipped back toward $80,000. The 7-day average is 58 and the 30-day average is 67, so sentiment has cooled steadily from Greed. Over its full history, the index has spent 25.66% of days in Neutral and only 4.72% in Extreme Greed. A cooler reading leaves more room for a recovery than the Greed readings of late September, since less optimism is already priced in.
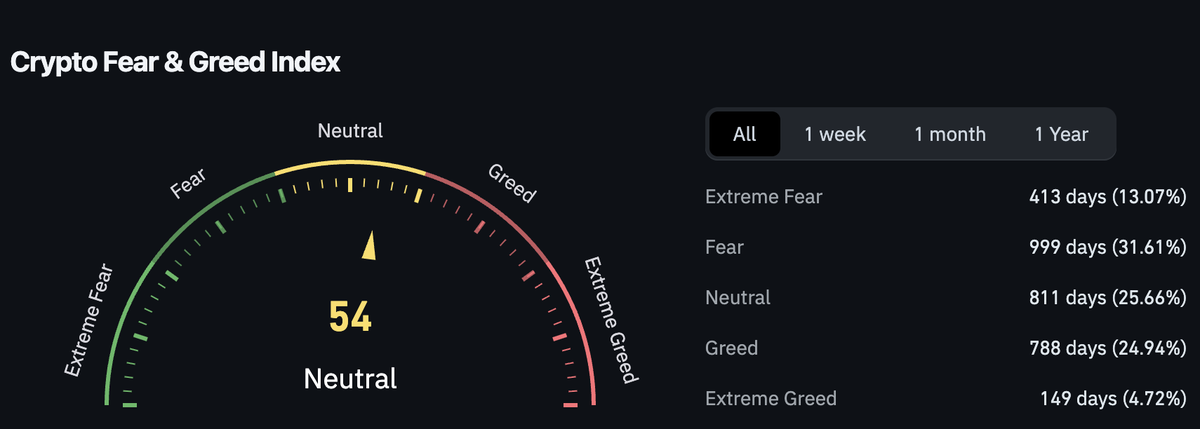
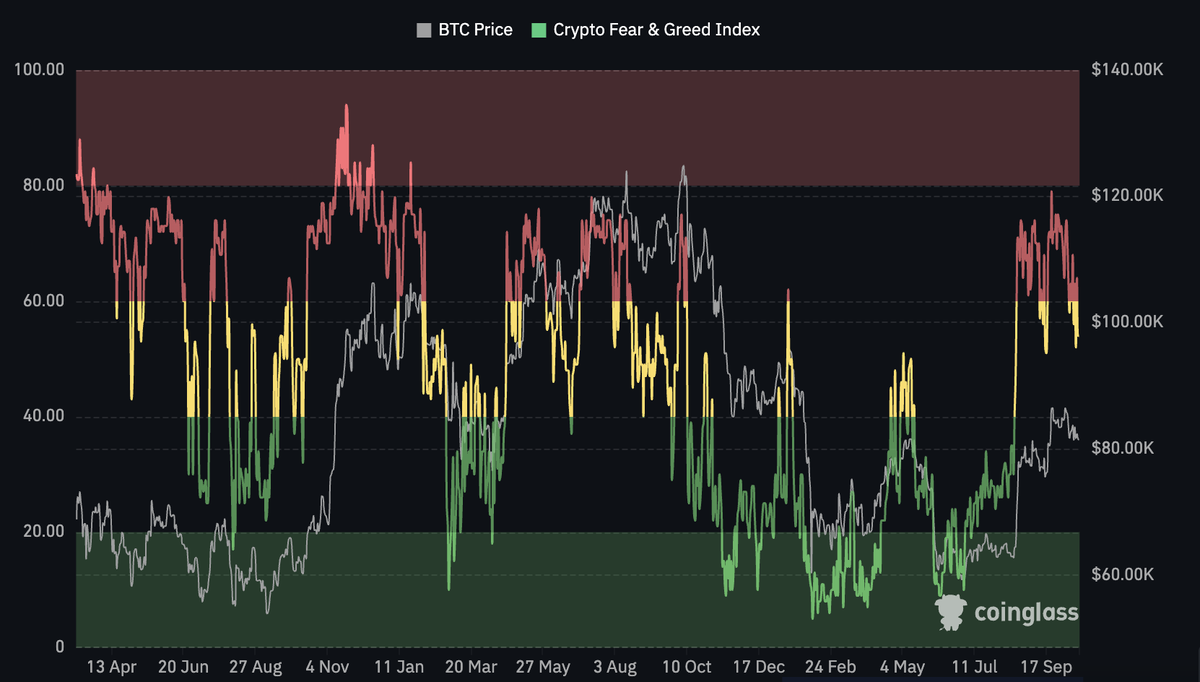
The longer history shows how quickly the mood turned. In July the index sat deep in Extreme Fear near 10 while Bitcoin traded around $60,000. The rally to 87,374 lifted it to about 79 in late September, just below the Extreme Greed zone that starts at 80. The pullback to the mid-50s has erased about a third of that swing, while price has given back roughly 7.5% from the high.
October lags history
Bitcoin is having a weak October by its own standards. At the October 15 open of $81,604 it was down 2.4% for the month, and intraday it touched $80,867, down 3.2%. The 2013 to 2025 average by mid-month is +6.7%, and the median is +3.8%, which leaves 2026 about 9 percentage points behind the average path at the halfway mark.
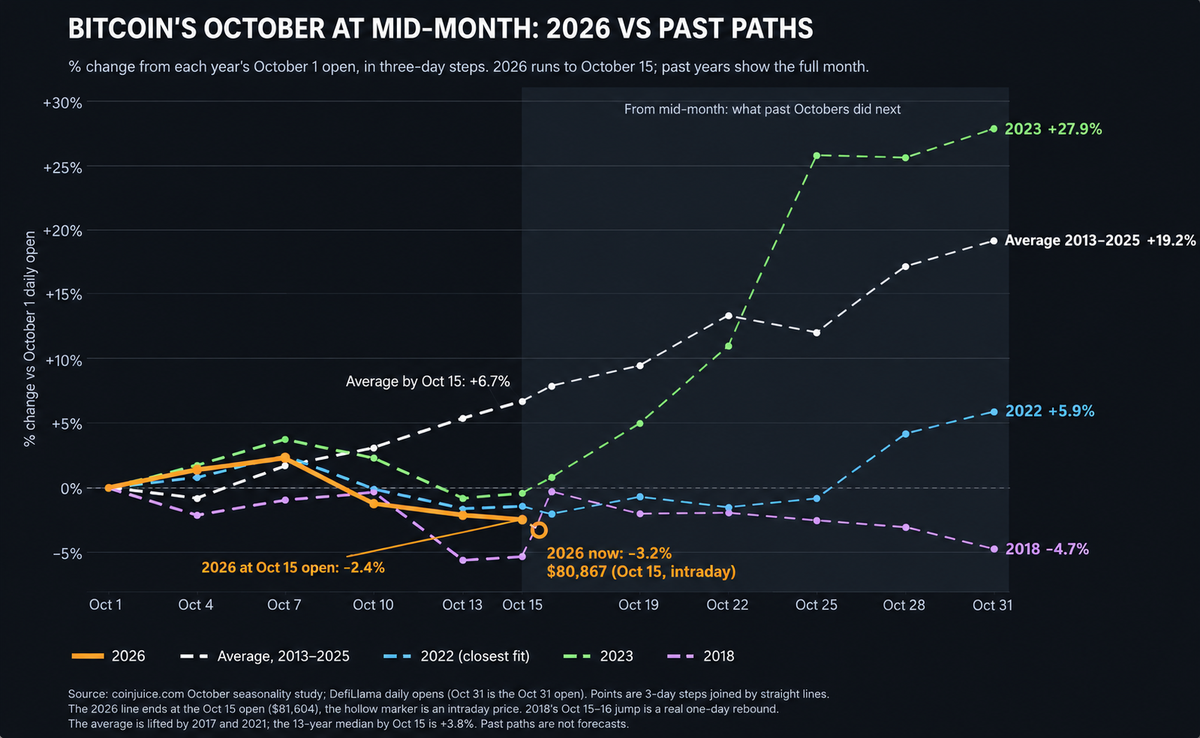
The closest historical fit is 2022, which was down about 1.4% at the same point and finished October up 5.9%. The weak case, 2018, ended the month down 4.7%, while 2023 rallied 27.9%. The full-month average of +19.2% is lifted by 2017 and 2021, and past paths are not forecasts. They do show that a soft first half has not ruled out a positive month.
Whales add about 70,000 BTC
CryptoQuant’s whale balance tracks wallets holding at least 1,000 BTC and excludes exchange and mining pool addresses. It rose from about 2.93 million BTC in late September to roughly 3.0 million in early October, an increase of around 70,000 BTC in two weeks.
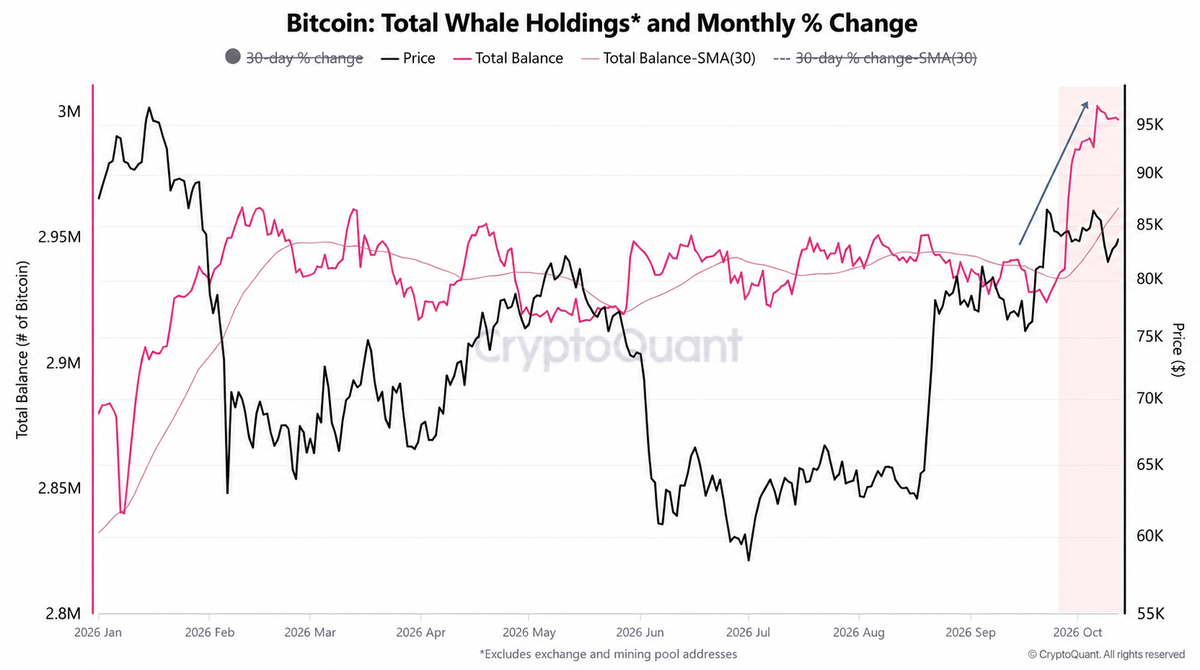
The 30-day moving average has turned up sharply, and CryptoQuant CEO Ki Young Ju says whales have switched from selling to accumulating. The balance is at its highest since November 2025. It has dipped only slightly during this week’s selloff, so large holders have not added to the selling that showed up in ETF flows.
Bitcoin liquidation map
The 30-day CoinGlass liquidation map, taken with Bitcoin at $80,887, is skewed to the upside. Cumulative short liquidation leverage builds to about $11.4 billion by $91,271, against roughly $4.8 billion of long leverage down to $72,556. The largest short clusters sit at $84,400 to $84,800 and $87,500 to $88,000, where single bars reach $370 million to $455 million. The nearest long cluster sits right below price at $79,500 to $80,400, overlapping the 80,106 level.
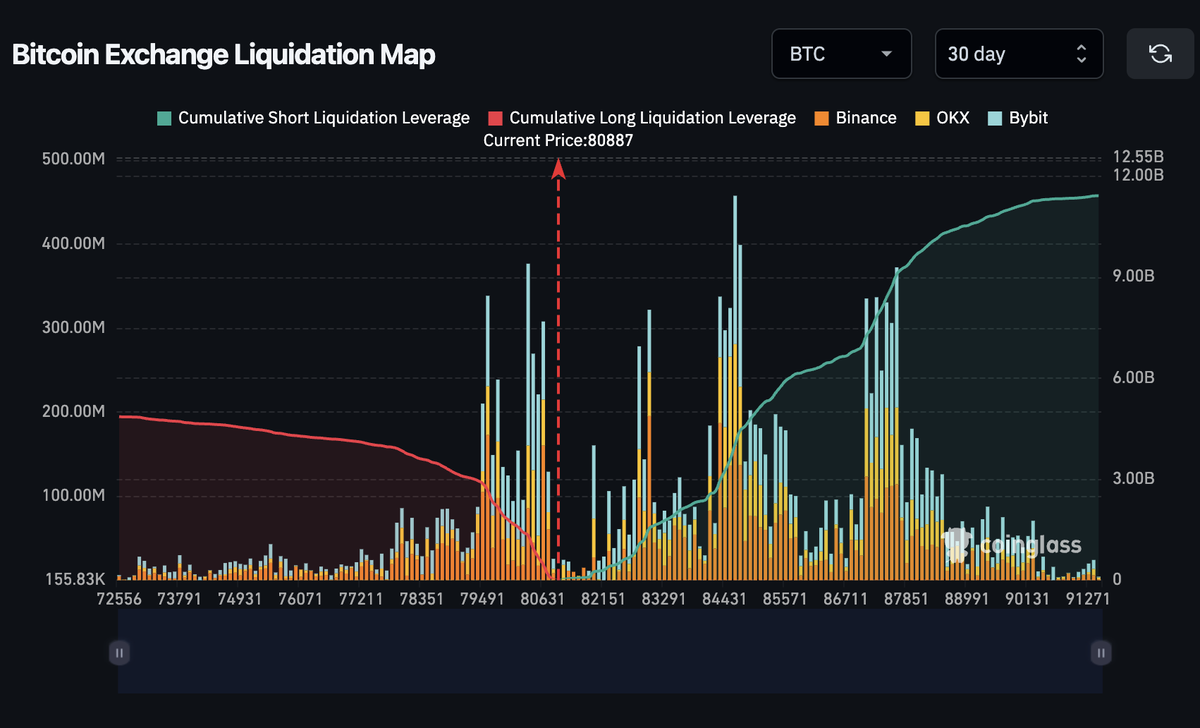
A quick sweep of those longs followed by a recovery above 80,106 would clear the nearest fuel below price and leave the larger short clusters as the next magnet. In that case, a move through $84,400 opens the path toward $88,000 and the $90,000 area where cumulative short leverage flattens out. A sustained break below $79,500 would instead remove that cushion and point toward 75,568.
Conclusion
Bitcoin ended a risk-off week near $81,960 with the 80,106 level intact. Macro is the headwind: hotter inflation, 10-year Treasury yields above 5% and about $910 million of ETF outflows in two weeks. Positioning is the tailwind: whales added around 70,000 BTC, sentiment has cooled to Neutral, and short liquidation leverage above price outweighs longs below by more than two to one. If 80,106 holds and the descending trendline breaks, the path opens toward 84,254, 87,374 and the $90,000 area. A 4h close below 80,106 would shift the focus to 75,568.
Trading involves risk.
Author



 Risk Disclaimer
The content provided here is for informational purposes only. It is not intended as personal investment advice and does not constitute a solicitation or invitation to engage in any financial transactions, investments, or related activities. Past performance is not a reliable indicator of future results.
The financial products offered by the Company are complex and come with a high risk of losing money rapidly due to leverage. These products may not be suitable for all investors. Before engaging, you should consider whether you understand how these leveraged products work and whether you can afford the high risk of losing your money.
The Company does not accept clients from the Restricted Jurisdictions as indicated in our website/ T&C. Some services or products may not be available in your jurisdiction.
The applicable legal entity and its respective products and services depend on the client’s country of residence and the entity with which the client has established a contractual relationship during registration.