8 min read
 Technical picture
Bitcoin last traded at $64,509.8 bid against a $64,558.7 ask, essentially flat after a high of $64,924.3 and a low of $64,235.1. Price has been rejected twice at the same shelf, marked 1 and 2, where a faster moving average sits near $64,915 to $64,971.9.
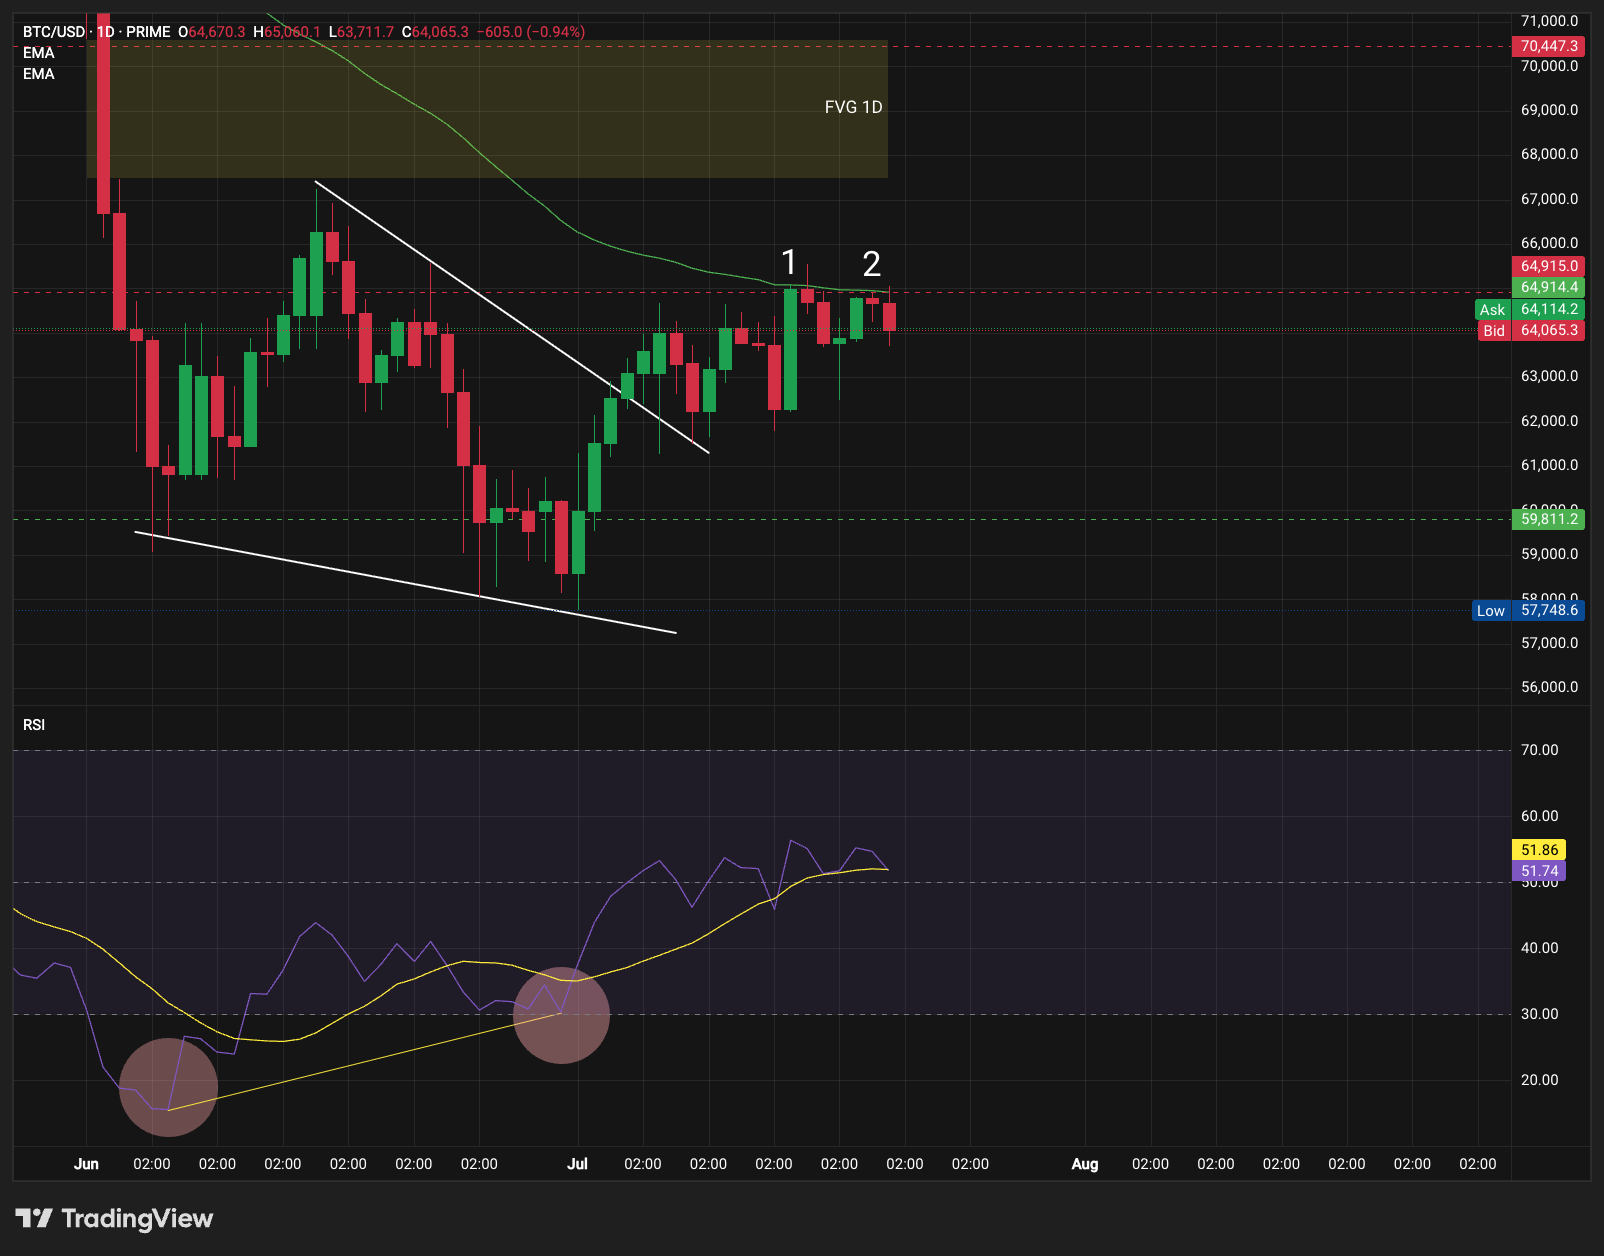
A slower moving average is still sliding lower from near $70,447.3, overlapping an unfilled fair value gap spanning roughly $65,000 to $69,000. A break and hold above $64,972 opens that gap; failure keeps the month-long range between $59,811.2 and $65,000 intact. Behind it, a falling wedge from near $67,000 in early June to a low of $57,748.6 broke to the upside before price retested $59,811.2 and pushed back toward the wedge’s origin.
Crypto heatmap
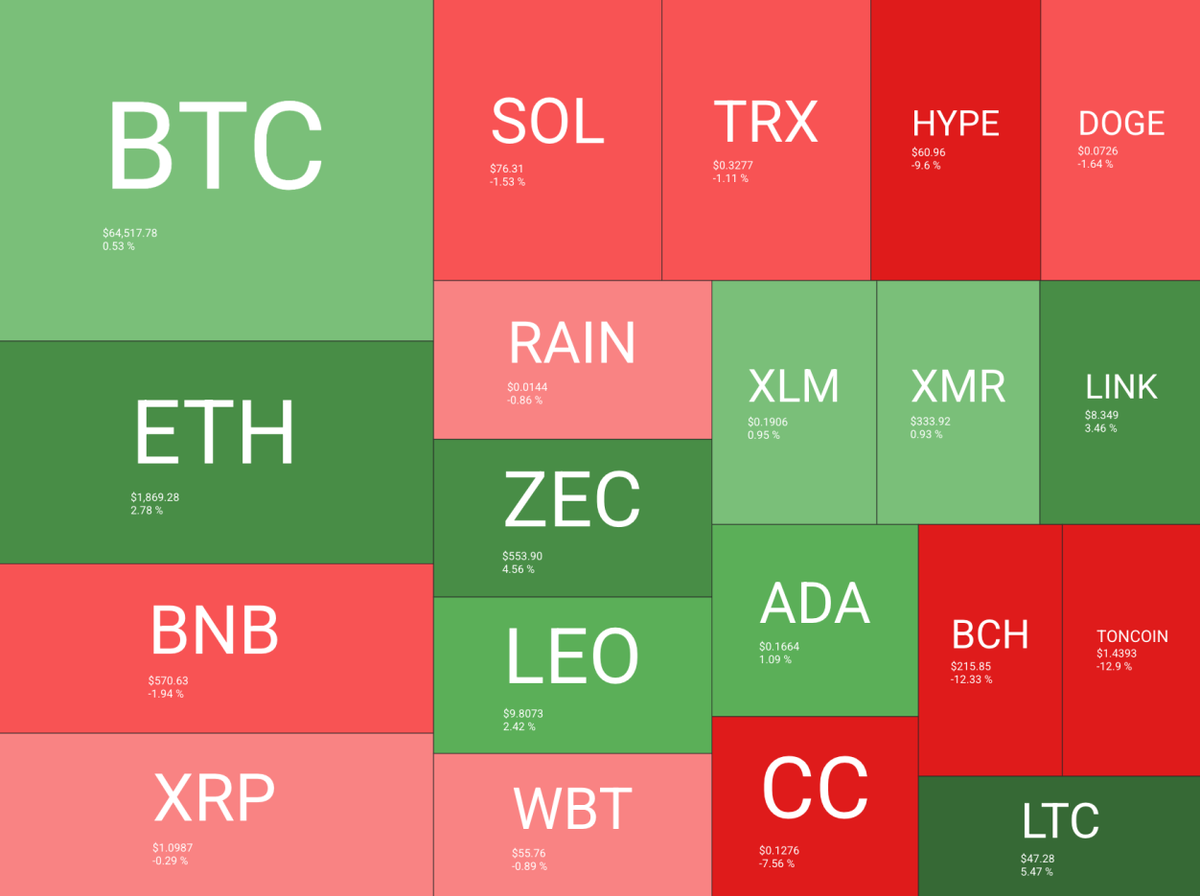
Bitcoin held close to flat, up 0.53% to $64,517.78, while the rest of the board split sharply. Zcash led the majors, up 4.56% on the day and roughly 25% over the past month on the July 17 Zakura Node release and the Ironwood upgrade due July 28. Litecoin gained 5.47% and Chainlink 3.46%, a rotation some compare to Zcash’s own earlier breakout. Ethereum added 2.78%, Cardano 1.09%.
Source: https://quantifycrypto.com/heatmaps
The decliners were sharper. Toncoin dropped 12.9% and Bitcoin Cash gave back 12.33%, unwinding part of a bounce that had carried BCH from under $200 to above $220 in under a week after a slide that cut more than 60% off its 2026 value. Hyperliquid fell 9.6%, a pullback inside a token still up roughly 160% year to date and near its June all-time high of $75.52. The split matches the neutral reading the altcoin season index below shows.
Altcoin Season Index
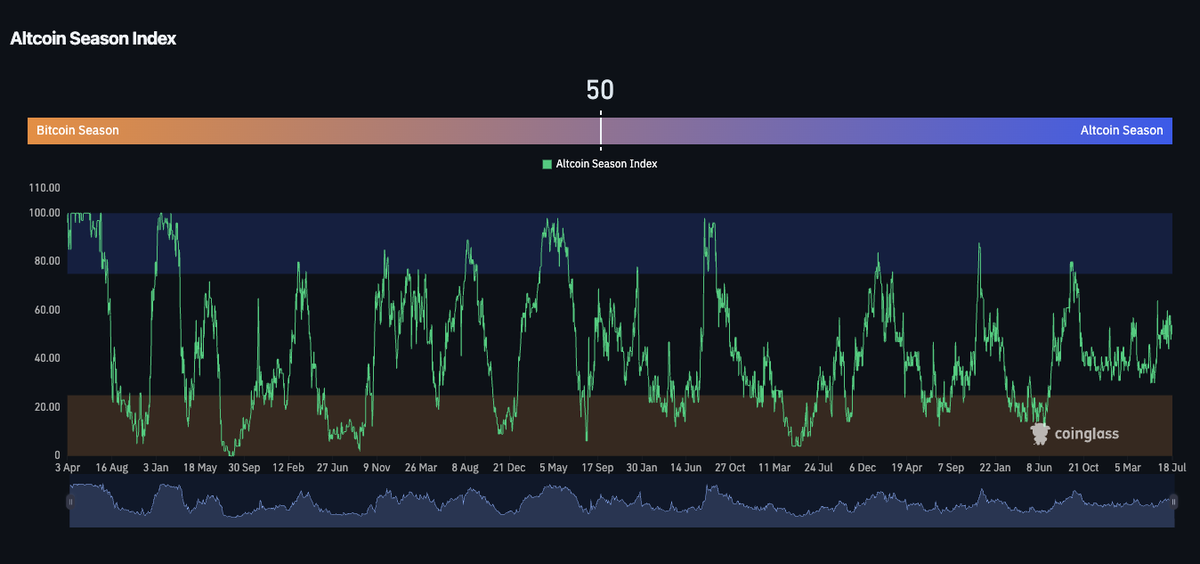
Coinglass’s Altcoin Season Index eased to 50 from 54 a week earlier, sitting exactly on the line separating a Bitcoin-led market from an altcoin-led one.
Source: https://www.coinglass.com/pro/i/alt-coin-season
The index has swung between roughly 10 and 95 over three years; 50 usually marks indecision, consistent with the split heatmap above.
Fear and Greed Index
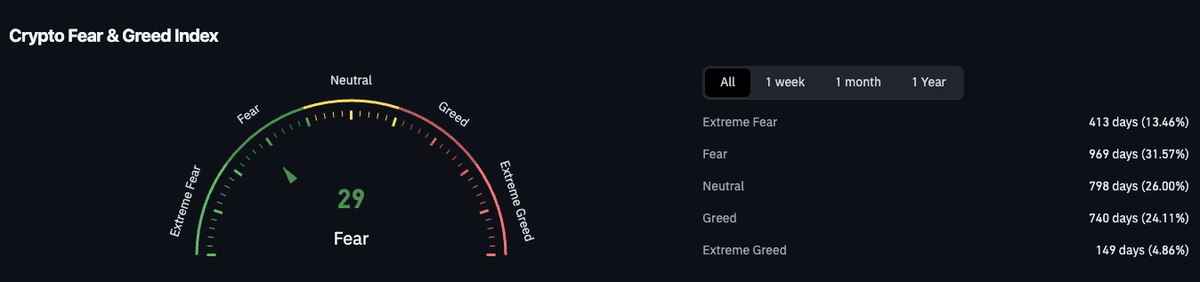
The Crypto Fear and Greed Index, per Coinglass, reads 29, still inside Fear but well off the extreme fear readings that have dominated its history: Extreme Fear alone accounts for 413 days (13.46%) and Fear for 969 days (31.57%), together 45% of the index’s history.
Source: https://www.coinglass.com/pro/i/FearGreedIndex
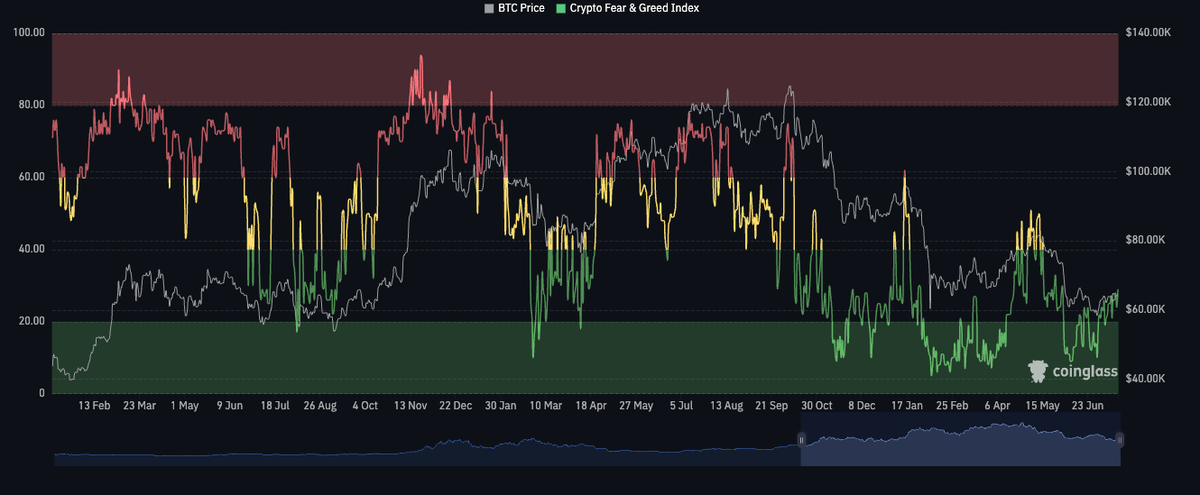
Prior climbs out of extreme fear this cycle, in January and May, preceded joint moves higher in the index and price, stalling near the 40 to 50 neutral band. A return there would harden the case that sentiment has bottomed alongside the technical setup above.
Macro data
The Bureau of Labor Statistics reported June headline CPI at 3.5% year over year, down from 4.2% in May and cooler than the 3.8% consensus, on a 0.4% monthly drop led by a 5.7% fall in energy costs, the steepest since April 2020. Core CPI held flat on the month for a 2.6% annual rate, below the 2.9% forecast and May’s print.
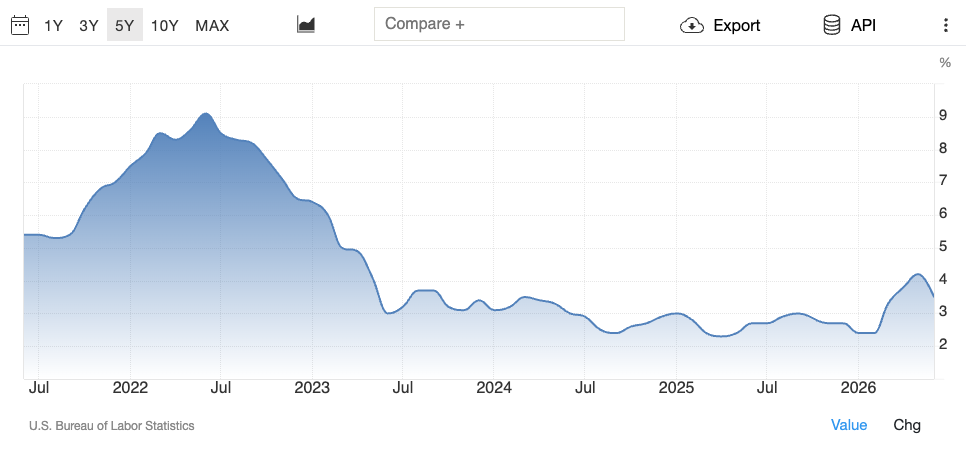
Fed Chair Kevin Warsh pushed back on calling it “mission accomplished,” and markets still price a possible rate move in September rather than a cut, with renewed Iran conflict risk keeping the inflation path uncertain. A cooler print is typically supportive for risk assets, but the Fed’s hesitation is why the relief has been partial.
ETF accumulation
Spot Bitcoin ETFs are still digging out of their worst month on record. June 2026 produced roughly $4.5 billion in net outflows, the largest since the funds launched in January 2024. Six straight negative days from June 23 to 30 totaled roughly $2.17 billion, peaking at a $691.7 million single-day outflow on June 25. July 1 added another $296.0 million before the pattern broke.
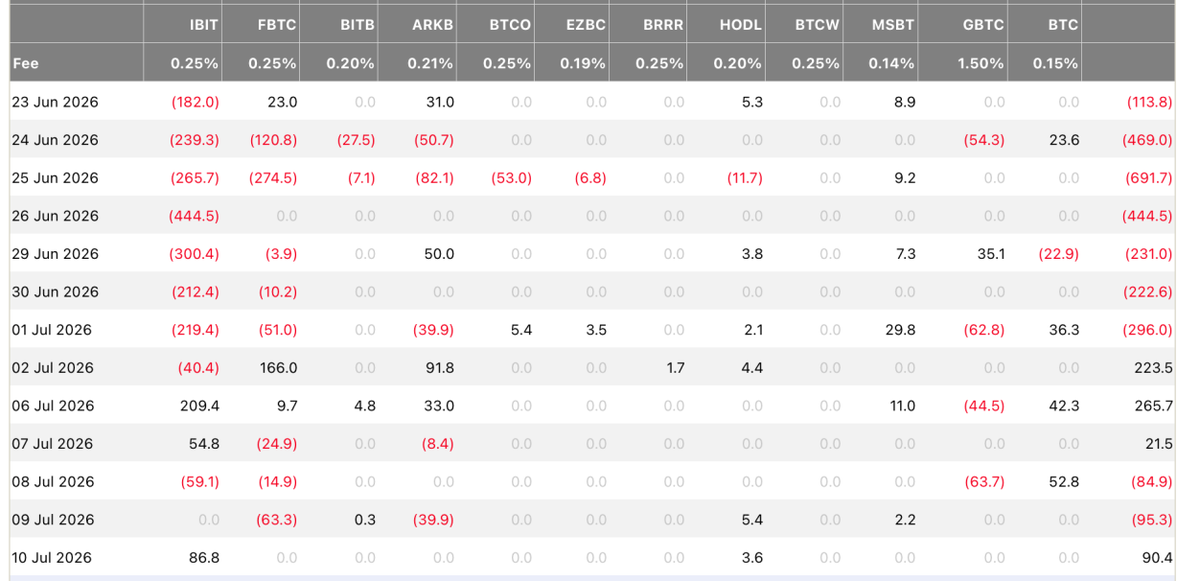
July 2 turned positive for the first time, at $223.5 million, and July 6 added $265.7 million more. The rebound was uneven, outflows resumed July 8 and 9 ($84.9 million and $95.3 million), but by July 17 the complex had strung together a four-day, $75.5 million weekly inflow, IBIT alone taking in $136.5 million that day. Whether that is a genuine turn or a short-covering bounce, the on-chain metric below helps answer.
On-chain metric to watch
Glassnode’s realized price framework puts the setup in context. Bitcoin now trades below the Short-Term Holders’ Cost Basis, in the high $60,000s and declining, above the all-time Realized Price near the low $50,000s, below the Active Realized Price near $84,000 and below the True Market Mean near $77,000.
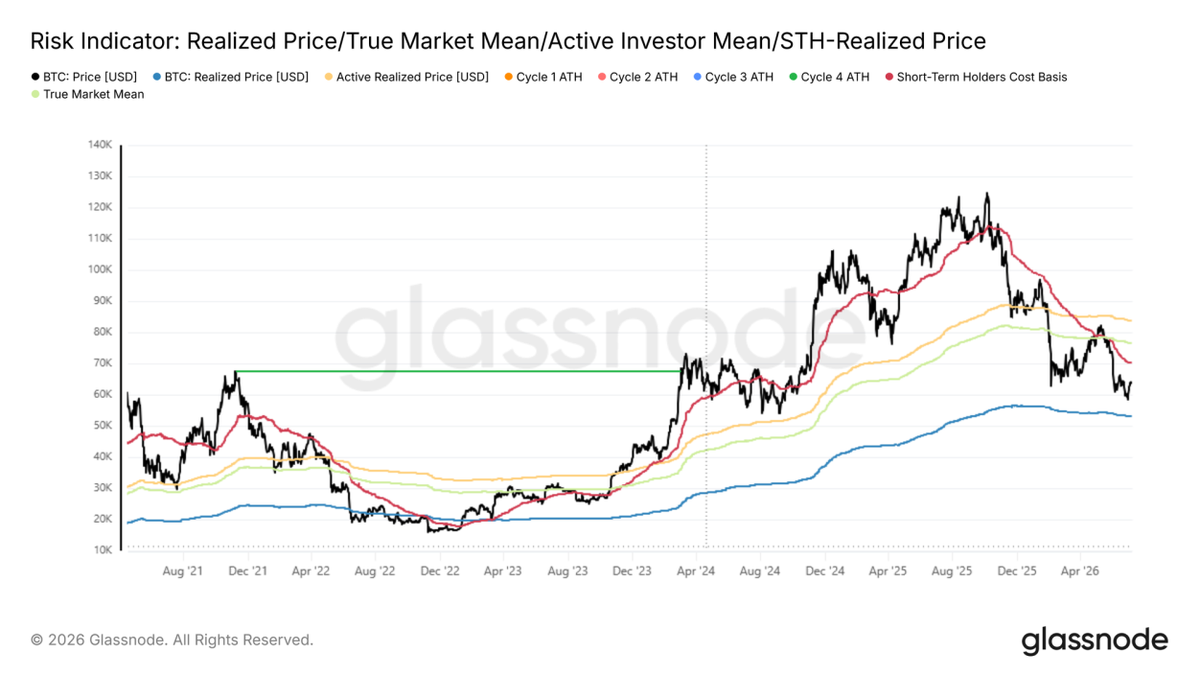
In the two prior cycles shown, price traded below the STH cost basis for five to six months before reclaiming it, each reclaim starting a multi-month recovery rather than a fresh leg down. A reclaim would fall within one to three months if that holds, though a longer sideways stretch is also possible, which is why the Strategy story below matters as a supply-side risk.
Strategy sells Bitcoin for the first time
Strategy sold 3,588 BTC for $216 million between June 29 and July 5, the largest Bitcoin disposal in company history and its first outright sale, redirecting proceeds to fund preferred-stock dividends. Michael Saylor confirmed it: “Strategy has sold 3,588 $BTC for $216 million to fund dividends on our Digital Credit securities.” The company still held roughly 843,775 BTC as of July 5, a small fraction of the position sold, but the shift from buyer to seller is the headline.
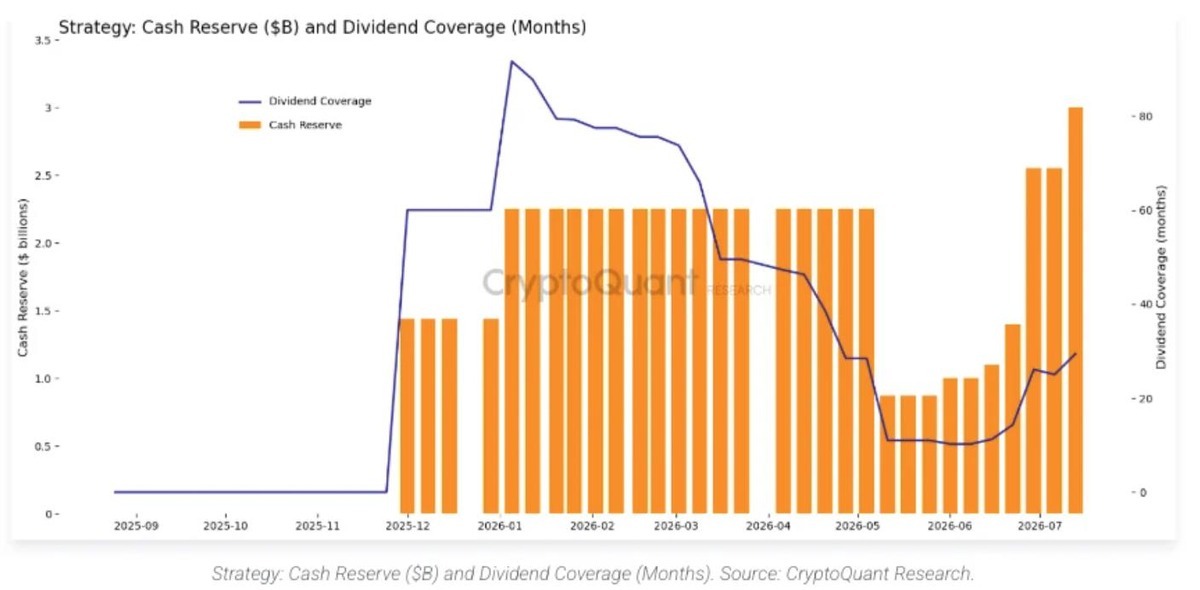
Strategy has also rebuilt its cash buffer without selling more Bitcoin: reserves fell to roughly $0.85 to $0.9 billion around May and June, then climbed to about $2.55 billion by early July and near $3 billion by July 12, helped by $466.7 million raised selling MSTR shares that week. Dividend coverage is 20.4 months as of July 12, up from a trough near 14 months in late May but short of the 30 months the draft assumed. The balance sheet is healthier, but Strategy still holds far more Bitcoin than the market absorbs daily, and further selling could cap the setup above.
Conclusion
Put together, the week reads as a market testing whether a month-long technical range, an altcoin index on the fence, a Fear and Greed Index climbing out of extreme fear, and ETF flows turning positive after a record outflow month can align into something durable. The cooling CPI print removes one obstacle; the Fed’s refusal to declare victory and renewed Iran risk keep another in place.
Strategy’s first-ever Bitcoin sale cuts against the recovery case: a company that had never sold now has, and dividend coverage remains under the level the draft assumed. If $64,972 breaks and the fair value gap fills, the technical setup has room toward $70,447; if it fails, the $59,811 to $65,000 range holds. Either way, the next few months, not the next few days, likely settle it.
Trading involves risk.
Author



 Risk Disclaimer
The content provided here is for informational purposes only. It is not intended as personal investment advice and does not constitute a solicitation or invitation to engage in any financial transactions, investments, or related activities. Past performance is not a reliable indicator of future results.
The financial products offered by the Company are complex and come with a high risk of losing money rapidly due to leverage. These products may not be suitable for all investors. Before engaging, you should consider whether you understand how these leveraged products work and whether you can afford the high risk of losing your money.
The Company does not accept clients from the Restricted Jurisdictions as indicated in our website/ T&C. Some services or products may not be available in your jurisdiction.
The applicable legal entity and its respective products and services depend on the client’s country of residence and the entity with which the client has established a contractual relationship during registration.