9 min read
 Key takeaways
- The Philadelphia Semiconductor Index has fallen more than 20% from its late-June peak after its worst week since April 2025, though it remains up more than 60% on the year
- The trigger was Chinese startup Moonshot AI’s Kimi K3, the largest open-weight model released so far, with full weights due to be published on 27 July
- Demand is not the issue here, with TSMC falling despite record results and raised guidance, so what is being repriced is how much the US artificial intelligence (AI) lead is worth paying for
- The Nasdaq is still holding the support zone it has defended for around 50 days, and 28,200 to 28,800 is the area that decides whether the chip weakness spreads
A selloff that has been building
Chip stocks had a rough week. The Philadelphia Semiconductor Index (SOX), the benchmark most traders watch for the sector, closed Friday more than 20% below the peak it set in late June after falling around 10% across five sessions, its worst week since April 2025. The Nasdaq lost 2.9% over the same period.
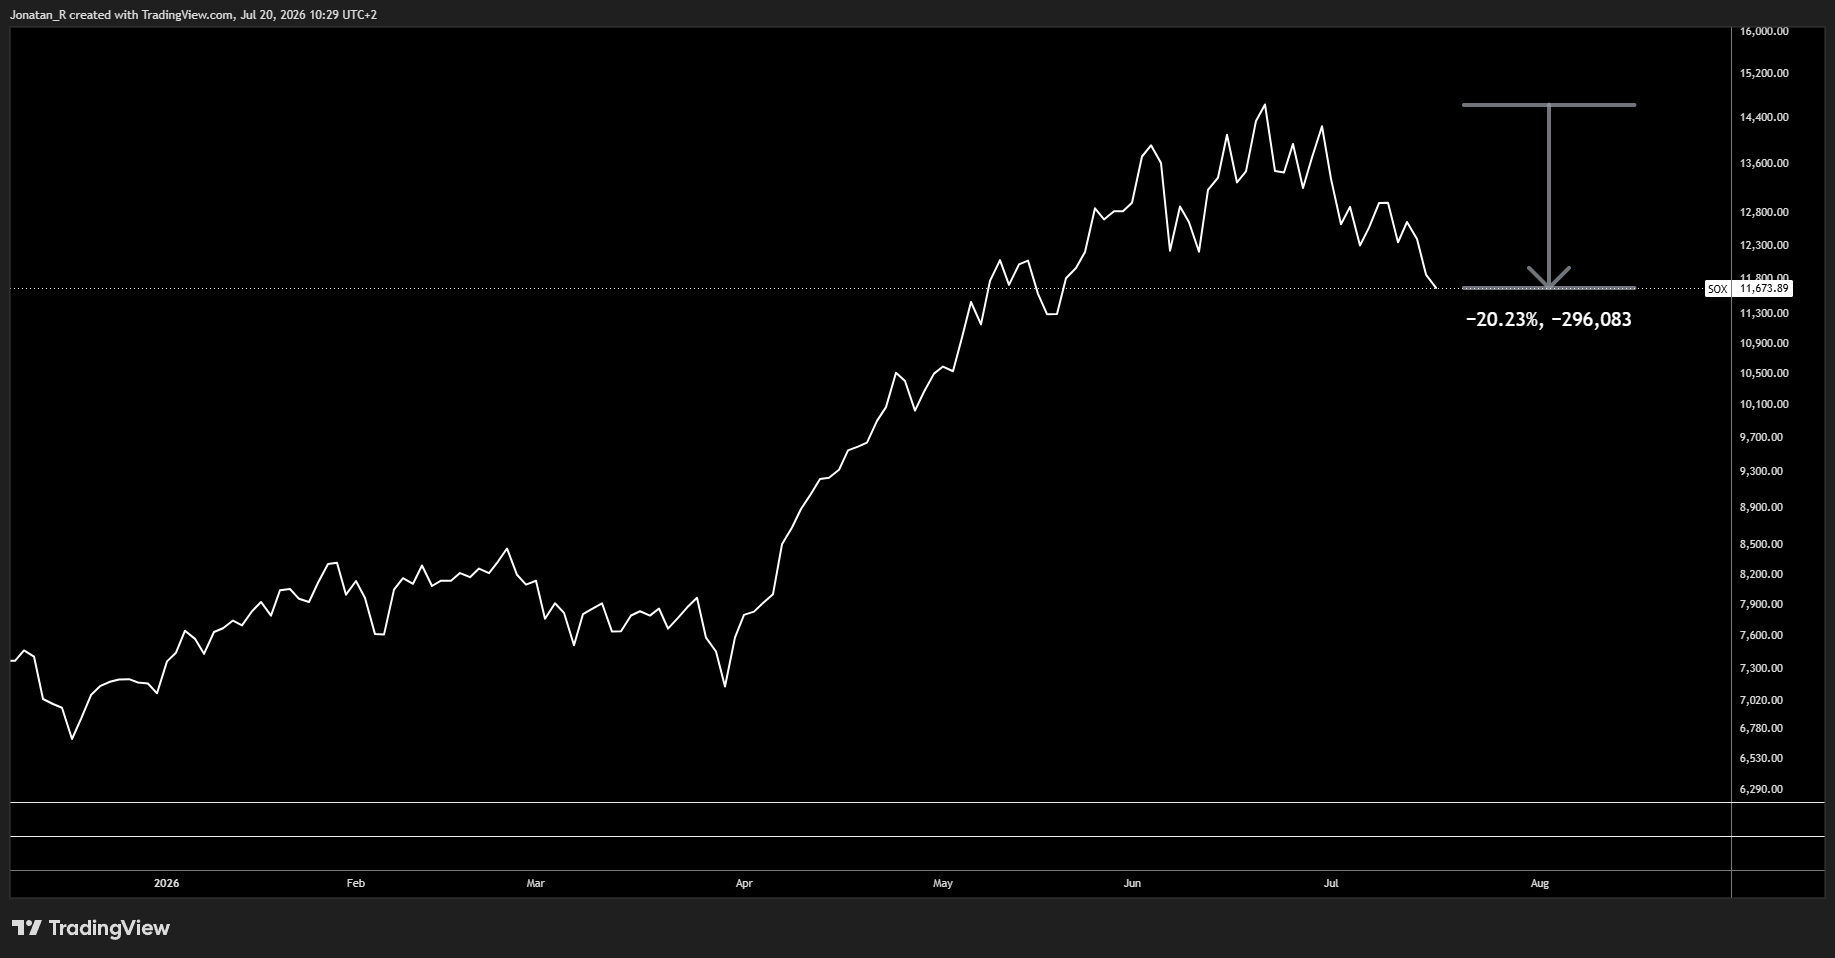
The semiconductor index has fallen more than 20% from its late-June peak, its steepest weekly drop since April 2025.
The index is still up more than 60% so far this year, though, and the memory names had already broken down some weeks before the rest of the sector caught up with them, so this has been building for a while rather than arriving all at once on Friday.
What Moonshot actually released
The trigger was Chinese startup Moonshot AI, which unveiled its Kimi K3 model on 17 July at the World Artificial Intelligence Conference in Shanghai. At 2.8 trillion parameters it is the largest open-weight model released so far, and Moonshot has said it will publish the full weights on 27 July, which means anyone will be able to download the model and run it on their own hardware.
The open weights are what unsettled the market. A cheaper competitor selling access through an application programming interface (API) is a price war, but a frontier-class model that anyone can host for free puts pressure on the pricing power that the entire AI build-out is being financed against. Moonshot is charging roughly $15 per million output tokens against around $50 for the top US tier.
Alibaba followed on Sunday with a preview of its own 2.4 trillion parameter model, which it described as second only to the leading US system. That one is still proprietary, with open weights promised but no date attached, so it carries less weight on its own than it does as a second data point in the same week.
Record results were not enough for TSMC
Taiwan Semiconductor Manufacturing Company (TSMC) reported last week with revenue up around 36%, a record gross margin of 67.7%, net profit up 77% and full-year revenue growth guidance lifted above 40%, and the shares fell regardless. The company also raised its capital spending plans by more than the market had expected, which read across the sector as pressure on margins rather than as a sign of confidence.
Nobody is seriously questioning demand at this point, which is what makes the reaction worth noting. What is being repriced is how much that demand is worth paying for, and the bar had been set very high after months of outperformance.
This is not a rates story
What makes the move harder to explain is that the rate pressure on high-multiple technology stocks actually eased last week. June Consumer Price Index (CPI) came in at -0.4% on the month and 3.5% annually, both well below what economists had expected, and the odds of a hike at this month’s Federal Open Market Committee (FOMC) meeting fell from roughly 42% to the low teens. Markets are now pricing around 85% odds of a hold on 29 July.
Falling rate risk would normally support these stocks rather than weigh on them, so the selling appears to be coming from competition rather than from the discount rate, and that puts more weight than usual on this week’s earnings.
What to watch this week
Alphabet and Tesla report on Wednesday and Intel on Thursday, which should give the first real read on whether AI spending plans are holding. Kimi K3’s weights are due on 27 July, the day before the Fed meets. Brent crude is back above $90 on a ninth consecutive night of US strikes on Iran, and that remains the live risk to the softer inflation picture that has been supporting equities.
We now head over to the charts to see whether this is a sector problem or the start of something broader.
The daily chart
In our previous coverage of the Nasdaq earlier this month we were watching a symmetrical triangle with support at 29,290. That level has since given way and price is now trading in the zone beneath it.
Looking at the daily chart, we see that the Nasdaq rallied just over 35% from the lows at the end of March, and that move came out of a consolidation phase that ran for around 100 days before it.
Since then we have been consolidating again, and we are now roughly 50 days into this range. What stands out is that the recent news out of the AI industry has not been enough to push the Nasdaq down to the lows of this consolidation. Price is still holding inside the range rather than breaking out of it.
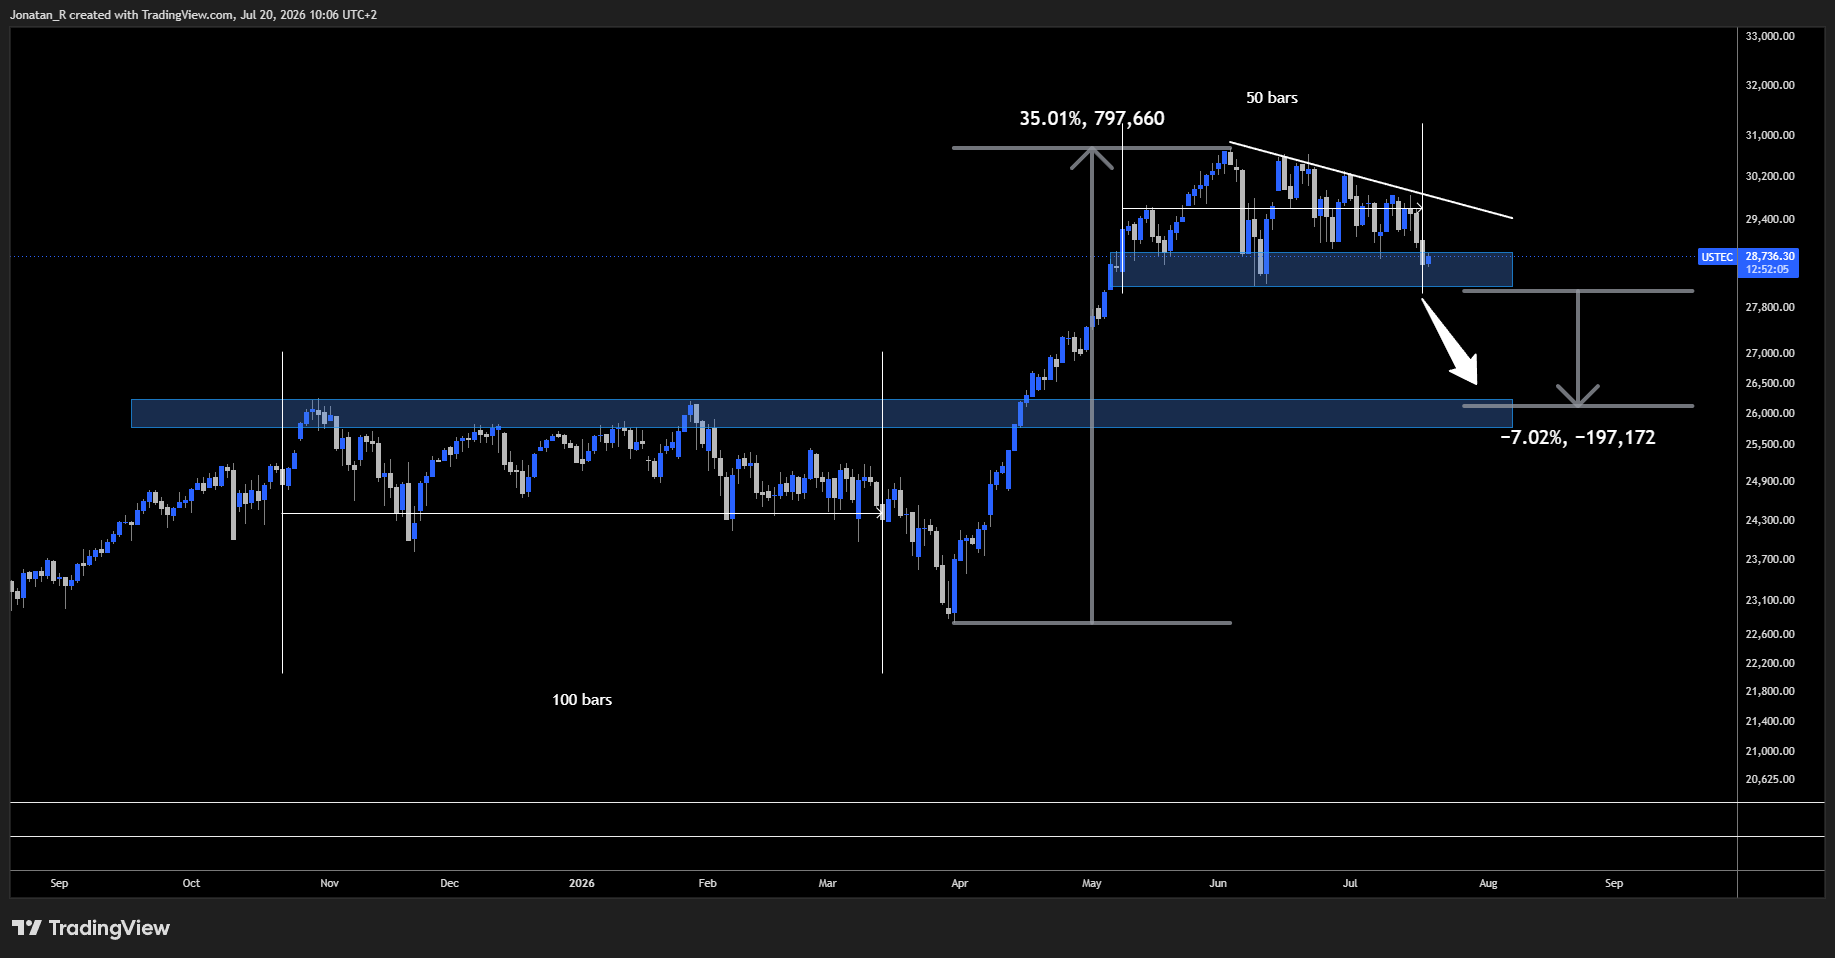
The Nasdaq has spent around 50 days consolidating in this range, and the high timeframe support zone beneath price is still holding.
We do see a window for a potential 6 to 7% move to the downside from here. If this current support fails to hold and we break below this high timeframe support area, that would likely cause a bigger and more volatile move lower, and it would confirm a breakdown and a potential break of structure.
As long as this support holds, though, we are still in consolidation. We have seen the Nasdaq make some major moves inside the previous consolidation phase even on severely negative news, so this range has absorbed a lot before.
The 4-hour chart
On the 4H we see a potential consolidation forming here at support, with price potentially using this high timeframe level as a base for further upside.
Looking at the rather impulsive move that started on 15 July and took us down into this level, we are looking at this market from the perspective of mean reversion. There is a possibility of coming back up to test the local resistance zone at around 29,200, and we also have the area between the 0.5 and 0.618 fib levels sitting untested just beneath it.
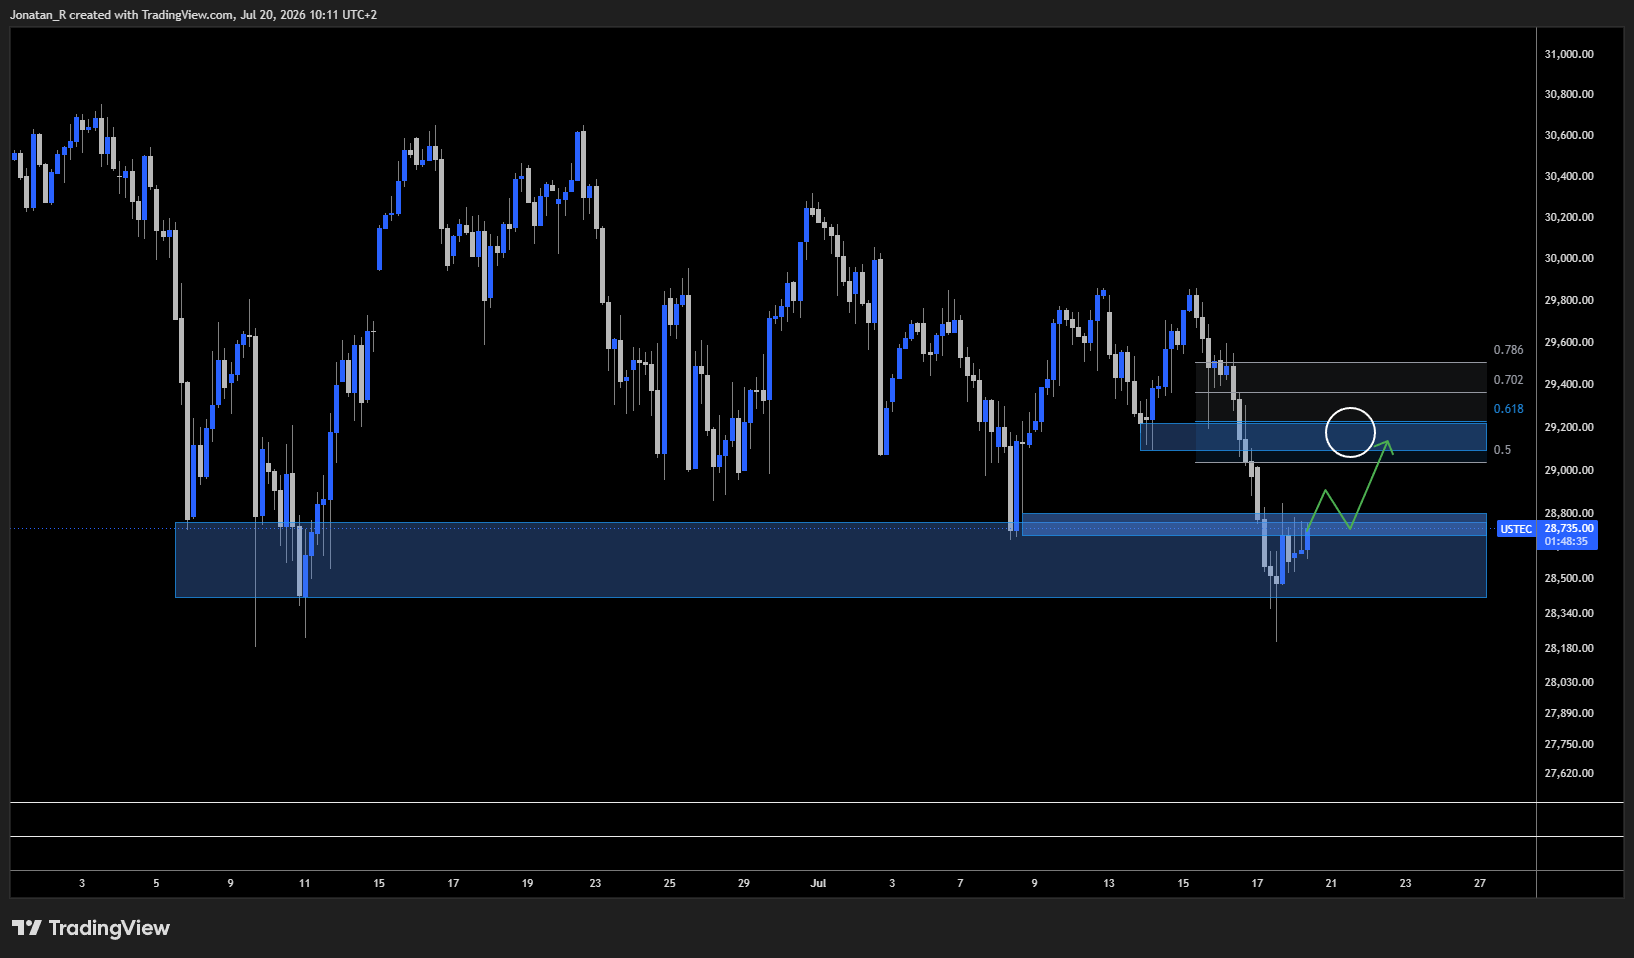
Price is basing at support after the impulsive move down from 15 July, with resistance at 28,750 and the local zone at 29,200 above it.
On the lower timeframes there is a clear resistance zone at around 28,750. If we can get a break and retest of that area, we could potentially see a move up into that local resistance zone. A reclaim of 29,200 could open more upside and see the Nasdaq recover from here.
If we fail to hold this area and 28,750 acts as resistance instead, and we continue lower and break that important level at 28,500, then we could potentially see a deeper correction across the tech sector.
Key levels to watch
- 28,200 to 28,800: high timeframe support zone on the daily. Holding it keeps the index in consolidation, losing it opens a potential 6 to 7% move lower
- 28,750: lower timeframe resistance. A break and retest could open the move higher
- 28,500: important level beneath. A break here could point to a deeper correction across the tech sector
- 0.5 to 0.618 fib zone: untested, sitting just under 29,200
- 29,200: local resistance zone. A reclaim could open further upside
Trading involves risk.
Author



 Risk Disclaimer
The content provided here is for informational purposes only. It is not intended as personal investment advice and does not constitute a solicitation or invitation to engage in any financial transactions, investments, or related activities. Past performance is not a reliable indicator of future results.
The financial products offered by the Company are complex and come with a high risk of losing money rapidly due to leverage. These products may not be suitable for all investors. Before engaging, you should consider whether you understand how these leveraged products work and whether you can afford the high risk of losing your money.
The Company does not accept clients from the Restricted Jurisdictions as indicated in our website/ T&C. Some services or products may not be available in your jurisdiction.
The applicable legal entity and its respective products and services depend on the client’s country of residence and the entity with which the client has established a contractual relationship during registration.