17 min read
 The Nasdaq 100 trades near 29,200 in late August 2026, roughly 5% under its 52-week high of 30,762, set in early June. The index (traded on PrimeXBT as an index CFD) holds the 100 largest non-financial companies listed on the Nasdaq exchange, weighted by a modified market-capitalisation method based on listed shares, and it is the benchmark that turns any argument about artificial intelligence into a price. This page sets out PrimeXBT’s outlook through 2030 and out to 2050, the levels that decide the next move, the rule changes that reshaped the index this year, and the case on both sides of the AI trade. Numbers appear as bands, not as targets to the point, and one warning belongs up front: published forecasts for this index are far scarcer than for the S&P 500, and this page says so where it matters.
Nasdaq 100 outlook at a glance
- 2026 base case: 28,125–31,861 points, averaging near 29,825 across the remaining months, with a year-end anchor around 30,200.
- What the market is pricing: prediction markets put roughly 16% odds on a 2026 close above 33,000, having had the index close to a coin flip on finishing above 30,000 in early July.
- Biggest downside risk: chipmakers are around a fifth of index weight, and a break of the 200-day average near 29,070 removes the last technical floor before the July low.
- Long-term view: the outlook compounds at well under half the index’s own historical rate, and anything past 2030 is a direction rather than a level.
Live Nasdaq 100 chart
Live pricing sits on the chart below. The technical section further down covers which of those levels currently matter.
Trading involves risk.
Nasdaq 100 forecast 2026–2030
PrimeXBT’s expected range for each year, in index points:
| Year | Minimum | Average | Maximum |
|---|---|---|---|
| 2026 | 28,125 | 29,825 | 31,861 |
| 2027 | 28,576 | 31,500 | 35,697 |
| 2028 | 29,872 | 33,564 | 37,256 |
| 2029 | 30,775 | 35,578 | 40,381 |
| 2030 | 31,678 | 37,712 | 43,746 |
Two things set that trajectory. Earnings inside this index are growing faster than anywhere else in the market, with the information-technology component of the S&P 500 posting 70% profit growth in FactSet’s August update. Against that, the index carries the market’s most concentrated valuation risk and its sharpest sensitivity to long-term bond yields. The path above assumes profits keep the index climbing while the multiple slowly gives ground, and the bands widen faster than the S&P 500’s because this index moves more: Nasdaq’s own factsheet puts its annualised volatility at 22.9% against 19.9% for the S&P 500.
Nasdaq 100 forecast 2026
PrimeXBT expects the Nasdaq 100 to finish 2026 near 30,200, inside a range of roughly 28,125 to 31,861 for the rest of the year. That anchor sits below the June record close, which is the deliberate part: recovering the high would take the semiconductor complex making another leg without the hyperscalers stalling further. Past months are excluded from the table because they are history.
| Month (2026) | Minimum | Average | Maximum |
|---|---|---|---|
| September | 28,125 | 29,450 | 30,775 |
| October | 28,274 | 29,700 | 31,126 |
| November | 28,423 | 29,950 | 31,477 |
| December | 28,539 | 30,200 | 31,861 |
Note what the band tolerates. The bottom of the September range sits close to the 28,500 shelf that broke during July’s slide, so a repeat of that episode fits inside the forecast rather than breaking it.
Nasdaq 100 forecast 2027
PrimeXBT’s 2027 range runs from about 28,576 to 35,697, averaging near 31,500, with the monthly path rising from roughly 30,400 in January to 32,600 by December. Semiconductor revenue is the load-bearing assumption: the industry’s own trade body expects global chip sales of $1.51 trillion in 2026 and $1.9 trillion in 2027, growth of 90% then 27%. Deceleration on that scale still leaves an expanding market, and this index owns the companies serving it.
| Month (2027) | Minimum | Average | Maximum |
|---|---|---|---|
| January | 28,576 | 30,400 | 32,224 |
| February | 28,667 | 30,600 | 32,533 |
| March | 28,756 | 30,800 | 32,844 |
| April | 28,844 | 31,000 | 33,156 |
| May | 28,931 | 31,200 | 33,469 |
| June | 29,016 | 31,400 | 33,784 |
| July | 29,101 | 31,600 | 34,099 |
| August | 29,184 | 31,800 | 34,416 |
| September | 29,265 | 32,000 | 34,735 |
| October | 29,346 | 32,200 | 35,054 |
| November | 29,425 | 32,400 | 35,375 |
| December | 29,503 | 32,600 | 35,697 |
2027 is where the AI bill arrives. Infrastructure bought in 2026 takes 18 to 36 months to produce proportional returns, on Futurum Group’s estimate, which puts the payoff window and the depreciation charge in the same year.
Nasdaq 100 forecast 2028–2030
From 2028 the model stops forecasting events and compounds instead, growing the index about 6% a year in price terms from the end-2027 anchor. That gives averages near 33,564 in 2028, 35,578 in 2029 and 37,712 in 2030, with bands widening from 11% to 16% either side.
6% deserves justification, because it looks timid against this index’s record. The Nasdaq 100 has compounded at about 14% a year since its 1985 launch, and close to 21% a year in total return over the last decade. Neither is a planning number: the ten-year figure is a bull-market artefact, and the institutions publishing forward assumptions for US equities are clustered between 3% and 7% total return a year. A 6% price path plus this index’s thin dividend lands modestly above those assumptions, which is the most a growth benchmark can claim without simply extrapolating the best decade it ever had.
Nasdaq 100 long-term forecast: 2035, 2040, 2050
A quarter-century projection for a technology index is arithmetic wearing a costume. The constituent list will turn over several times, and half the companies that will dominate this index in 2050 do not exist yet. Slowing the compounding to 5.5% beyond 2030 produces the following, and the width of each band is the only part worth taking literally:
| Year | Minimum | Average | Maximum |
|---|---|---|---|
| 2035 | 38,536 | 49,405 | 60,274 |
| 2040 | 46,491 | 64,570 | 82,650 |
| 2050 | 68,383 | 110,295 | 152,207 |
What analysts and models say
Almost nobody on Wall Street publishes a Nasdaq 100 target. Every large bank’s headline index call is on the S&P 500, and tech exposure is expressed through sector weights and earnings estimates rather than an index level. Anyone quoting “a bank’s Nasdaq target” is usually deriving one. What does exist:
| Source | View | Index | Date |
|---|---|---|---|
| Wedbush, Dan Ives | 30,000 within a year, from 26,247 | Nasdaq Composite | 11 May 2026 |
| Wedbush, Dan Ives | “Third inning” of the AI cycle, chip demand outpacing supply 12 to 1 | Sector view | 27 Jul 2026 |
| Kalshi prediction market | ~16% odds of a 2026 close above 33,000; ~11% for 32,000–33,000 | Nasdaq 100 | 26 Aug 2026 |
| Kalshi, earlier reading | Roughly even odds of a 2026 close above 30,000 | Nasdaq 100 | 7 Jul 2026 |
| IG | 32,700, the 100% Fibonacci extension of the April–October 2025 uptrend | Nasdaq 100 | 1 Jun 2026 |
| StockCharts, David Keller | Base case (55% weight) a decline toward the 38.2% retracement; upside scenario 5% | QQQ | 5 Jun 2026 |
The prediction market is the more useful of these, because it prices a distribution rather than a point. In early July it treated a close above 30,000 as roughly a coin flip; in late August it gives only about 16% to a close above 33,000, which is the market thinning out the upside tail while the index sits 5% off its high. Tom Lee of Fundstrat, one of the more consistent bulls, holds an 8,000 year-end call on the S&P 500 and still warned in July that August to October “might feel like a bear market”. Both can be true.
Track record of this forecast
PrimeXBT has not published a Nasdaq 100 forecast before this one. From the next monthly review onward, this section will set the previous forecast against the index’s actual level and account for the gap, including when the gap is unflattering.
Nasdaq 100 technical analysis
The Nasdaq 100 is wedged between its two main moving averages, roughly 0.7% below the 50-day at 29,418 and about 0.5% above the 200-day at 29,065. That second number is the one to watch, because it is the only structural support between the current level and July’s low near 27,200.
Above the market, 30,000 has behaved as psychological resistance all year: the index first cleared it in late May, peaked at 30,762 in early June, and was turned back near 30,196 in mid-August. Below, 28,500 is the shelf that gave way in July and 27,000 was the next downside target named in DailyForex’s monthly outlook at the time. Momentum is middling rather than weak, with the 14-day RSI near 48, and the signal frames disagree: the daily set reads bearish while the weekly stays constructive, a split that usually resolves in favour of the longer frame.
Breadth improved sharply through the August rebound, with more than 70% of constituents back above their 200-day average by 10 August, the strongest reading in over a year. All readings are as of publication and revised at each monthly review. Providers disagree materially on this index’s averages, and figures here follow the daily cash-index series rather than intraday CFD data, which produces very different numbers.
Correlation with other assets
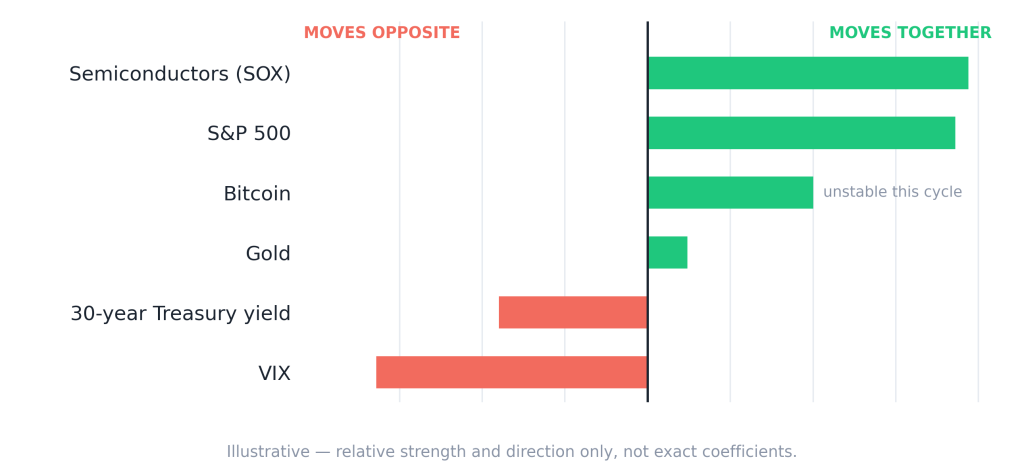
Semiconductors are the mechanism, not a metaphor. Chipmakers are roughly a fifth of index weight on holdings data, and the fit is close to mechanical: the semiconductor index gained 88% in the second quarter and lost 20.6% in July, which traced the shape of the Nasdaq 100’s own best quarter in six years followed by a 6.6% July decline. The index also shadows the S&P 500 closely, with a 93% daily return correlation on Nasdaq’s own measurement, so the two are not a diversification pair.
The rate relationship is the counterintuitive one. Across 13 rising-rate episodes between 1985 and 2021 the Nasdaq 100 averaged a 22.6% gain, double the S&P 500’s, because higher rates historically came with the growth this index captures. Nasdaq’s own study on that data adds the caveat that matters now: the relationship inverts once absolute yields clear 5%. The 30-year Treasury yield topped 5.33% on 18 August, a 19-year high. On bitcoin the honest answer is that no reliable current coefficient exists, only evidence that the link swung from deeply negative to positive inside a fortnight in February. Treat every relationship on the chart as this cycle’s, not a constant.
Fundamental factors
Valuation first, because it is less alarming than the commentary suggests. The Nasdaq 100’s forward price-to-earnings ratio is about 22.4, which is no higher than its own ten-year average and below its five-year average on the same series. Against the S&P 500’s forward 20.0, the growth premium is a little over two points. For scale, this index’s forward multiple peaked near 82 in May 2001. Expensive is not the same as 2000.
Concentration is the harder problem. The top ten holdings are roughly 46% of the index, technology is 68.5% of it on Nasdaq’s own classification, and financials are excluded by design. The 2026 composition story is the semiconductor takeover of the upper ranks: Nvidia sits near 8.5%, Apple near 7.0% and Microsoft at 5.8%, while Micron has climbed to fifth at about 4.5% and AMD sits sixth. A single earnings miss in that cohort moves the whole index.
The index rulebook itself changed in 2026, which is unusual and worth knowing. From 1 May, eligibility and ranking count both listed and unlisted shares, the March, June and September reviews can now admit new members instead of only December, companies in the top 40 by full market capitalisation get a fast-track entry, and low-float securities enter with a graduated weight cap. SpaceX joined on 7 July under those rules at roughly 1% weight despite a valuation in the trillions, precisely because the float cap phases it in. The June review added Astera Labs, CoreWeave, Nebius, Rocket Lab and Teradyne while removing Charter, Cognizant, Insmed, Verisk and Zscaler, a turnover that tells you where the index is heading. The separate emergency mechanism, a special rebalance, triggers when one company exceeds 24% weight or the group above 4.5% together exceeds 48%; that cohort currently sits near 27%, so it is not close.
Upcoming catalysts
Only confirmed, dated events are listed.
| Date | Event | Potential impact |
|---|---|---|
| 4 September 2026 | August employment report | Growth data now cuts both ways for rate-sensitive growth stocks |
| 11 September 2026 | August CPI | Inflation surprises hit long-duration equities hardest |
| 15–16 September 2026 | FOMC meeting, with economic projections | The rate path is this index’s main macro lever |
| 21 September 2026 | Quarterly index rebalance takes effect | Under the new rules, additions are now possible at this review |
| 13 October 2026 | Q3 earnings season opens with the large banks | Sets the tone before the mega-cap tech reports that follow |
| 27–28 October 2026 | FOMC meeting | Statement language carries the weight without projections |
| 3 November 2026 | US midterm elections | Tech regulation and tariff expectations reprice |
| 8–9 December 2026 | FOMC meeting, with economic projections | Frames 2027 positioning |
| 21 December 2026 | Annual reconstitution takes effect | The year’s largest scheduled change to the constituent list |
FOMC dates follow the Federal Reserve’s published 2026 schedule and CPI and payroll dates the Bureau of Labor Statistics calendar. Rebalance dates follow the Nasdaq 100 methodology, which sets both effective on the first trading day after the third Friday of the quarter-end month. CPI also lands on 14 October, 10 November and 10 December, and payrolls on 2 October, 6 November and 4 December.
Bull case vs bear case
Bull case:
- Chip sales are forecast at $1.51 trillion in 2026 and $1.9 trillion in 2027 by the industry’s own trade body, with memory the fastest-growing segment.
- Hyperscaler capital spending is running between $660 billion and $690 billion for 2026 on Futurum Group’s February count, close to double 2025, with JPMorgan putting the four largest spenders alone near $725 billion in August.
- Microsoft’s roughly $80 billion unfulfilled cloud backlog reflects power constraints rather than weak demand, which is a supply problem with a fixable timeline.
- The forward multiple is only two points above the S&P 500’s, so the index is not pricing perfection.
Bear case:
- OpenAI’s roughly $20 billion of annual recurring revenue equals about 3% of projected 2026 hyperscaler capital spending, and every pure-play AI vendor combined is likely under $35 billion this year.
- JPMorgan’s technical strategist flags a 1999-style split: semiconductors up 87% in 2026 while Microsoft posted its worst month since 2000 and Meta sits negative on the year.
- Long-end yields above 5% historically reverse this index’s rate advantage rather than extend it.
- The cyclically adjusted valuation of the broad US market has held above 40 since June, only the second such stretch in 155 years.
Invalidation levels. Losing the 200-day average at 29,070 on a weekly closing basis would strip out the constructive read and put 28,500, then 27,000, in scope. In the other direction, a weekly close back above 30,196, August’s rejection point, would say the June record is being challenged rather than defended.
Will the Nasdaq crash in 2026?
Nobody knows, and this index’s own history argues for taking the question seriously rather than waving it away. The Nasdaq 100 lost more than 80% between March 2000 and October 2002 and took some sixteen years to regain the peak, a drawdown far deeper than the broad market’s and the reason “tech index” and “risk” belong in the same sentence. It fell about 50% in the financial crisis and 28% during the 2020 crash on Nasdaq’s own accounting, lost 33% over calendar 2022, and recovered from all three.
The realistic near-term scenario is smaller than a crash. This index has already had two corrections in 2026: more than 10% in March, and 11.7% between the June record and the 29 July low. A third would be ordinary rather than remarkable, and would land inside the forecast band above. A bear market is the different animal, and the case for one rests on AI capital spending failing to convert into profit, which is a 2027 income-statement question rather than a 2026 one.
Historical performance
Price returns since 2016 read: 5.89%, 31.52%, −1.04%, 37.96%, 47.58%, 26.63%, −32.97%, 53.81%, 24.88%, 20.17%, and 15.68% so far in 2026. Two negative years in eleven, and the worse of them, 2022, cost nearly a third. The Nasdaq 100 has beaten the S&P 500 in 14 of the 18 calendar years since the end of 2007 while carrying about three percentage points more annualised volatility, which is the trade this index offers in one line. These are price returns; the index pays a thin dividend on top.
Is the Nasdaq 100 a good investment in 2026?
The index is up 15.7% on the year and still 5% below its June peak, having led the S&P 500 by roughly three and a half percentage points on a like-for-like price basis while the leadership underneath it rotated violently from hyperscalers to chipmakers. Someone who bought the index in January owns a good year; someone who bought individual mega-caps may not.
Concentration is the part that gets underestimated. A product with 100 holdings sounds diversified, and a product where ten names carry 46% of the weight is not, so the diversification this index provides is narrower than the constituent count implies. Separately, holding a Nasdaq 100 fund for a decade and trading a leveraged index CFD are unrelated activities with unrelated risk. PrimeXBT provides the second. Nothing in a 2030 projection justifies a leveraged position opened this week.
How to trade the Nasdaq 100 on PrimeXBT
PrimeXBT offers the Nasdaq 100 as an index CFD, which can be traded long or short whichever way this forecast points. The guides to trading the Nasdaq 100 and to index trading cover the mechanics, and the comparison of the three US indices is worth reading before choosing between them.
Three practical points specific to this instrument. Cash index CFDs track exchange hours, so overnight gaps are routine and a stop can fill past its level, which matters more here than on a broad index because single-stock earnings after the close move this index hard. Overnight positions carry a financing charge, and spreads widen outside the main session, covered in PrimeXBT’s breakdown of index CFD spreads. Leverage magnifies both directions, so size the position and set a stop-loss before entering. Trade your own analysis and risk tolerance, and never risk more than you can afford to lose.
Trading involves risk.
How we build this forecast
PrimeXBT’s analysts construct this outlook rather than copying a screen. The near-term anchor starts from the current level, the index’s position against its 50- and 200-day averages, and what prediction markets imply about the year-end distribution, since published sell-side targets for this index barely exist. The 2027 anchor works from semiconductor and hyperscaler spending forecasts against a forward multiple measured against its own history. From 2028 the path compounds at a rate set deliberately below this index’s long-run record, and each band widens with the horizon because the range of outcomes does.
This is an estimate, not a promise. A technology index concentrated in a handful of companies can move faster than any model, and a single earnings report can reset the picture. The outlook is reviewed and updated monthly.
What will the Nasdaq 100 be in 2026?
PrimeXBT's outlook is roughly 28,125–31,861 points for the remainder of 2026, averaging near 29,825, with a year-end anchor around 30,200.
What will the Nasdaq 100 be in 2030?
Our range is roughly 31,678–43,746, averaging near 37,712. That path compounds earnings growth rather than forecasting events, so treat it as a direction.
Where will the Nasdaq 100 be in 10 years?
Around 49,405 on our central 2035 path, within a band of roughly 38,536 to 60,274. A technology index will have replaced a large share of its constituents by then.
Can the Nasdaq 100 reach 40,000?
Not before 2029 on our numbers, when the top of the modelled band first clears 40,000. Prediction markets currently put only about 16% odds on a 2026 close above 33,000.
Is the Nasdaq 100 a good investment in 2026?
It is up 15.7% on the year and has beaten the S&P 500 in 14 of the last 18 calendar years, but it carries more volatility and far more concentration than the constituent count suggests.
What is the difference between the Nasdaq 100 and the Nasdaq Composite?
The Nasdaq 100 holds the 100 largest non-financial companies on the exchange. The Composite holds more than 3,500 listings, financials included. They move closely together, but the Composite has lagged this year, up about 12.2% against the Nasdaq 100's 15.7%.
Author



 Risk Disclaimer
The content provided here is for informational purposes only. It is not intended as personal investment advice and does not constitute a solicitation or invitation to engage in any financial transactions, investments, or related activities. Past performance is not a reliable indicator of future results.
The financial products offered by the Company are complex and come with a high risk of losing money rapidly due to leverage. These products may not be suitable for all investors. Before engaging, you should consider whether you understand how these leveraged products work and whether you can afford the high risk of losing your money.
The Company does not accept clients from the Restricted Jurisdictions as indicated in our website/ T&C. Some services or products may not be available in your jurisdiction.
The applicable legal entity and its respective products and services depend on the client’s country of residence and the entity with which the client has established a contractual relationship during registration.